A NATIONAL IMPERATIVE TO EXPAND EDUCATION OPPORTUNITY
Commentary on the 2015 National Assessment of Educational Progress (NAEP) Results
Jeanne Allen, Founder & CEO, The Center for Education Reform
(WASHINGTON D.C. 4.27.16) Today’s report by the National Assessment of Educational Progress (NAEP) is an urgent reminder of the crisis in U.S. education, with just 37 percent of all 12th graders making the grade in reading and 25 percent in math, and achievement gaps growing among minority kids. Only seven percent of African-American students scored proficient or better in math, and 17 percent scored proficient or better in reading. For Hispanic 12th graders, 12 percent scored proficient or above in math, and 25 percent scored proficient or above in reading. The number of 12th grade students failing to demonstrate even basic levels of math and reading achievement increased from the last time the test was administered in 2013.
THE JUSTIFICATION FOR EXPANDED OPPORTUNITY – SOBERING DATA
NAEP data combined with information on college readiness presents a clear picture on the need to improve and expand access to innovative learning opportunities:
- White and Asian students score as many as 40 percentage points higher than Black, Hispanic and other minority students.
- Clearly graduation rates have little relevance to achievement. Despite the U.S. graduation rate at an all-time high of 81 percent, 12th grade 2015 math and reading results reveal less than half of graduating seniors are prepared for college coursework. While 42 percent of 12th graders report being accepted to four-year colleges at the time of the NAEP assessment, research reveals 20 percent of first time students at four-year colleges require remedial coursework.
- At the community college level, approximately 60 percent of students enroll in at least one remedial course.
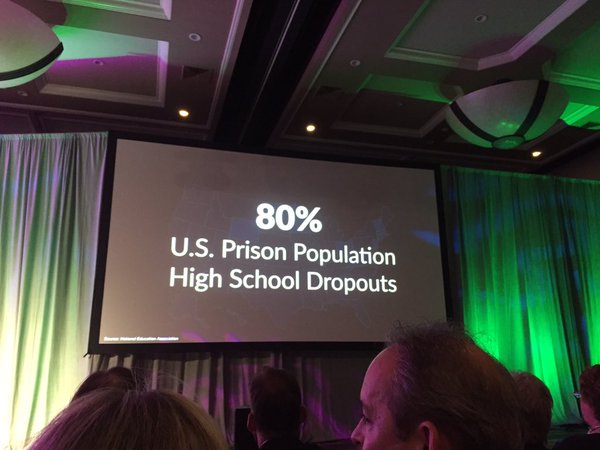
- While the dropout rate has slowed, this data doesn’t even account for those who don’t make it to 12th grade. Eighty percent of the U.S. prison population is high school drop outs. We must think creatively about how to create unique learning opportunities for students we have yet to reach.
SOLUTIONS EXIST
Highly credible research studies examining student achievement gains over time provide deeper insight on actual learning gains and show that students in opportunity-based learning environments are making progress at rates much faster than traditional school students. They are also making progress in narrowing achievement gaps among minority students:
- Using real data, over time, and accounting for numerous variations in school composition, size, longevity, and more, researchers from Vanderbilt & Georgia State find that charter high school graduates are more likely to stay in college and earn more in their adult life.
- In Washington D.C., 90 percent of students participating in the Opportunity Scholarship Program (OSP), serving an approximately 97 percent minority population with an average household income of less then $22,00, graduate. That’s 32 percentage points higher than D.C. public schools’ graduation rate of 58 percent. Additionally, 88 percent of D.C. voucher students who graduate go on to college.
- In Massachusetts, charter schools do a better job of closing the achievement gap for minority and low-income students. In Boston, charter schools have twice as many African-American students with advanced scores compared to traditional public schools.
- In California, novel thinking about providing access to arts education for low-income students resulted in boosted scores by more than double compared to other turnaround efforts.
THE NATIONAL IMPERATIVE
Amid these grim statistics, we can find hope in the fact that more and more entrepreneurs and policymakers are doing extraordinary things and breaking the mold to foster innovative learning opportunities that lead to better outcomes and results for our nation’s children. Twenty-five years ago, policymakers on both sides of the aisle in Minnesota came together to craft a novel policy, a charter school law, to allow for a new type of public school to solve the persistent problem of underachieving schools and a growing dropout problem. Today, there are more than 6,800 charter schools educating more than three million students. These schools were the first among public schools to show that innovations in teaching and learning can lead to student achievement, with results that outpace most comparable conventional schools and accomplishing this feat despite adverse funding conditions. As lawmakers enact more laws that provide children access to greater opportunities to achieve upward mobility, there is also unprecedented application of technological, teaching and system innovations being tested and applied.
This is the era in which schools find themselves, and yet the Nation’s Report Card demonstrates that the majority of schools have still not caught up with the pace of advancement sweeping other flexible schooling structures. Most students are still sitting in rows and amidst systems created when education was simpler, flatter and less homogeneous, and well before the age of labor contracts and large bureaucracies dictated the bulk of actions a school must undertake daily. To apply what works demands not only a reset on this outdated system, but meaningful measures that test and evaluate that which is working. NAEP provides only an aggregated snapshot of academic achievement across samples of students across states, and does not capture individual student progress or outcomes.
We do not have another 25 years to wait for the flexibility to apply the pathbreaking research and innovations that exist today to the schools of tomorrow. NAEP’s ongoing assessment of students does not change dramatically for better or worse year after year. While it is unwise to use NAEP scores to make speculations surrounding specific policies due to the nature of the data, we know that unleashing the power of innovation and opportunity can drive success for even the most disadvantaged students. Policymakers must free the schools. Schools must update their infrastructure to make learning more personalized in an increasingly technological and global world. And they must do so in a way that does not shut out access for those traditionally underserved by our education system. Resetting the landscape for structural change in education requires providing maximum opportunities for kids, teachers and families, and allowing flexibility for innovations to be tested and applied.
ABOUT NAEP
The National Assessment of Educational Progress (NAEP), often called “the Nation’s Report Card,” is designed to show students’ results over time, and has been in place since 1971. Whereas most standardized tests compare students to one another, NAEP compares them to where they should be as determined by standards adopted with widespread consultation across the education sector. Thus, it tends to be a more realistic appraisal of student performance. Over the years, this “nation’s report card” has become the barometer for assessing if U.S. students are meeting expected levels of performance.