The Nation's Report Card
Data and Analyses on the National Assessment of Educational Progress (NAEP)
The National Assessment of Educational Progress, also known as NAEP or the Nation’s Report Card, is a semi-annual assessment of the nation’s 4th, 8th and 12th graders on core subjects, and considered the gold standard of education. It is this report that is the most accurate in assessing student achievement across the US. This section will introduce you to analyses and commentary over the years, and the latest results.
2024 Results for Science at Grade 8 and Mathematics and Reading at Grade 12
September 2025
On September 9th 2025, the National Assessment of Educational Progress (NAEP), also known as the Nation’s Report Card, released the 2024 results from the 12th grade assessment on math and reading and 8th grade results from the 2024 science assessment, all showing a stark decline.
The latest NAEP scores confirm what parents and employers already know: our schools are failing at their most basic task. Only 22% of high school seniors are proficient in math and just 35% in reading — the lowest in more than 20 years. This matches the devastating 8th grade results released earlier this year and continues a decade-long slide that began well before the pandemic. The decline for African American students, whose 12th grade reading levels dropped 11 points, almost twice the rate of their white counterparts is one data point that exemplifies the inequity in our systems.
Forty years ago, A Nation at Risk warned that if a foreign power had imposed such results, we would have considered it an act of war. Today, the crisis is homegrown — and it is eroding America’s workforce and future competitiveness. You cannot lead in AI, aviation, or semiconductor manufacturing if your graduates can’t pass the nation’s benchmark test.
The Nation’s Report Card is clear: we must rebuild American education from the ground up. Start over. From scratch. And we must return power to parents, not bureaucracies, to drive their children’s education. The future of American innovation depends on it.
2024 4th and 8th Grade Math and Reading Scores Plummet.
January 29, 2025
The health of the nation’s schools remains in decline, as reading proficiency plummeted and mathematics scores saw modest gains, largely owing to the impact of more advantaged students whose families often supplement their education, according to data from the 2024 National Assessment of Educational Progress, released early this morning.
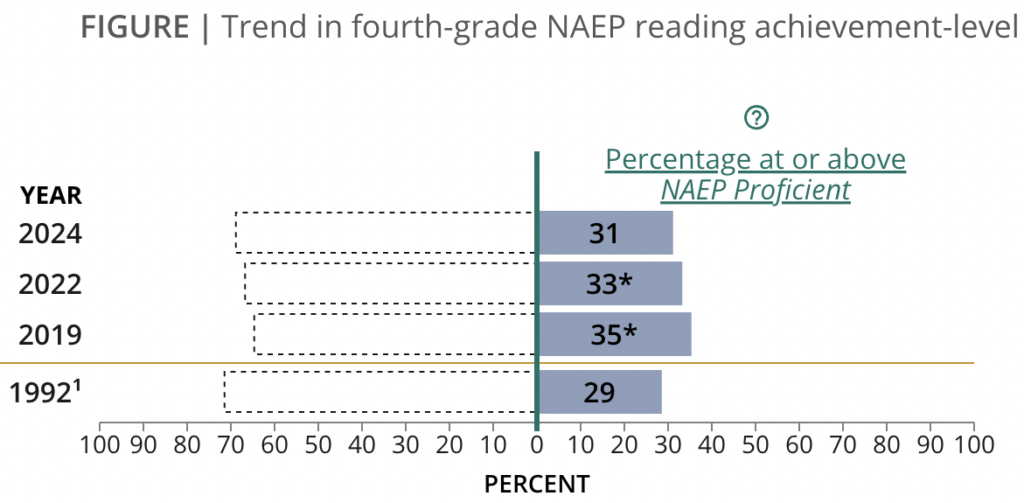
Only 31 percent of students in 4th grade and 30 percent of students in 8th grade are reading proficiently, a 2 percent and 1 percent drop respectively from 2022. Scores in reading have dropped 10 points since 2019. Numerous studies show that reading on grade level by third grade is inextricably linked to students’ future success.
“The data shows that the majority of the nation’s school systems have failed to master effective reading instruction, ignoring not only how it should be taught (e.g., proven science) but also the importance of engaging students with rich content and literature that stimulates the mind and ensures that vocabulary and comprehension increase,” said CER Founder & CEO Jeanne Allen.
“When students are not reading on grade level by third grade, their life-long choices are severely limited. One long-term study found that when a student fails to meet this bar, they are 4 times more likely to drop out of school. In fact, 88 percent of these dropouts were struggling readers in third grade,” says Mindy Sjoblom of On Your Mark education.
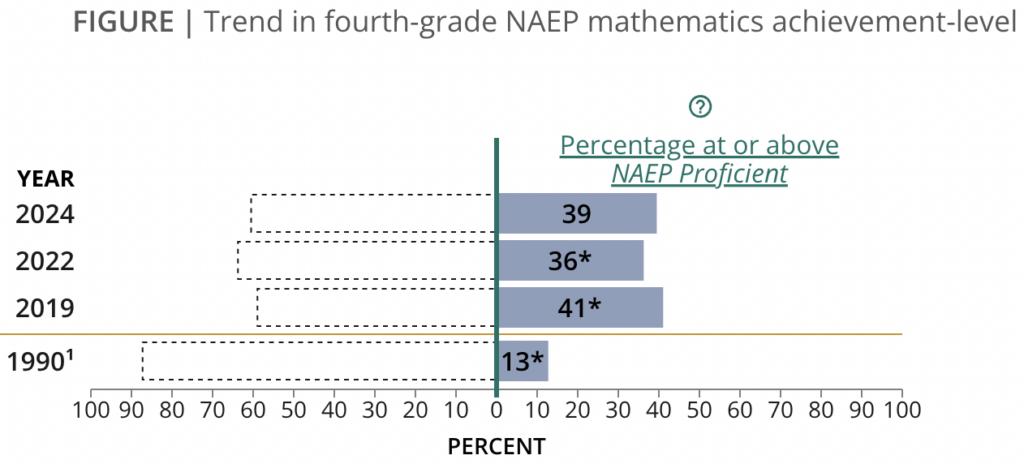
National averages for students in math show a slight score increase from 2022, but still three points behind 2019. Geographically, 4th grade mathematics scores improved in most states and urban districts compared to 2022. These students were in Kindergarten during Covid. In contrast, 8th grade performance – or 4th graders during Covid – declined in states such as Alaska, Idaho, Nevada, and Florida, with the most significant decreases occurring among students in the lower percentiles. Other states saw no significant changes, suggesting that while some areas have made progress, others continue to struggle with persistent challenges in math education.
However, from 2019 to 2024, math scores decreased for all 4th and 8th grade scorers in the bottom, middle and upper quartiles.
While 4th grade student proficiency rose 3% since 2022 to 40% proficient or above in math, 8th grade scores remained stagnant compared to 2022 with 28% proficient (up one point in advanced proficiency). Evidence shows an emerging pattern of disparity with 2024 levels still four points below 2019. Lower-performing students saw declines at the same rate that higher-performing students improved, indicating a growing divide.
More alarming is the fact that traditionally lower-performing students, including Hispanic students, disadvantaged students, students with disabilities, and English language learners all experienced notable declines—raising concerns about the accessibility and effectiveness of current educational strategies for these and other underserved student populations.
Geographically, 4th grade mathematics scores improved in most states and urban districts compared to 2022. In contrast, 8th grade performance declined in states such as Alaska, Idaho, Nevada, and Florida, with the most significant decreases occurring among students in the lower percentiles. Other states saw no significant changes, suggesting that while some areas have made progress, others continue to struggle with persistent challenges in math education.
Overall, 67% of 4th and 8th grade students remain below the basic proficiency threshold in mathematics. While improvements among higher-performing students contributed to slight gains, lower-performing students lagged behind at an average rate of 26%, further illustrating the uneven nature of progress.
“The federal government gave $192 billion primarily to state agencies and school districts to turn around educational challenges resulting from Covid, and all we have to show for it four years later is a doubling of staff and a couple of point increase in math among a small percentage of students,” said CER’s Allen. “It’s unconscionable.”
Additional data and analysis to determine the implications of the latest news and how states that have performed worse or better have achieved those results will be forthcoming. Follow us on and message us via X @edreform and visit us on the web at edreform.com
2022 RECORD EDUCATION DROP IS “ACADEMIC MALNOURISHMENT”
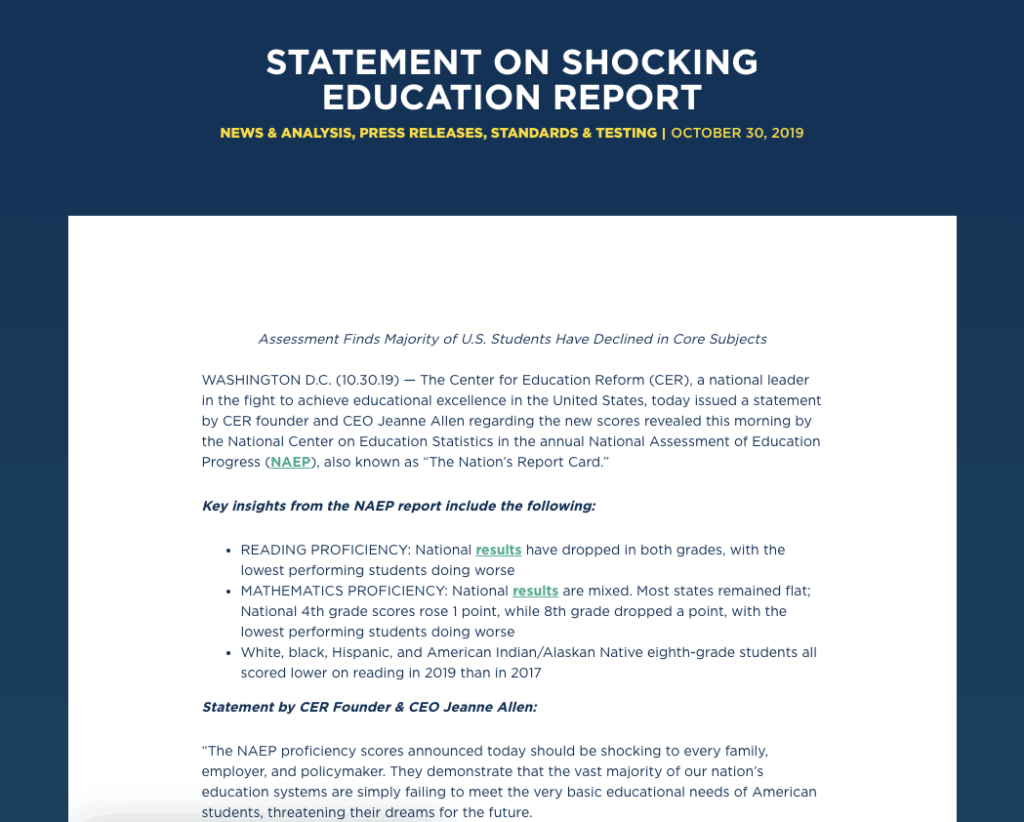
Latest NAEP Scores Are More Than Pandemic-related
The results of today’s National Assessment of Educational Progress (NAEP) show a massive decline in student achievement. One out of three students cannot do math or read at grade level. One out of four students are not able to perform even at minimal, basic levels. According to the report’s authors, “the national average score declines in mathematics for fourth- and eighth-graders were the largest ever recorded in that subject.”
“This record plunge on NAEP scores is a continuation of bad education policy, pandemic or not,” said Jeanne Allen, Founder and CEO of the Center for Education Reform (CER).
“This is academic malnourishment.”
NAEP Content Guide
2020 Results On History, Civics & Geography Assessment
The results of the latest nation’s Report Card reveal that only 15 percent of 8th grade students are proficient in history, and fewer than 24 percent and 25 percent are proficient in civics and geography, respectively. The scores disaggregated by race are more stark – with fewer than 50% of white students and only between 10-20% of minority students meeting proficiency levels depending on the subject.
The results should startle Americans.
Said Peggy Carr, the associate commissioner of the National Center on Education Statistics which administers the Nation’s Report Card: “The results provided here indicate that many students are struggling to understand and explain the importance of civic participation, how American government functions, the historical significance of events and the need to grasp and apply core geographic concepts.”
Just last fall, both math and reading assessments revealed that student achievement was either flat or dropping for most US students. There had been no significant change from the prior 2017 assessment in math and marked decreases in reading. Reading scores were lower in more than half of the states at grade 8 since 2017.
NAEP & A NATION AT RISK
A ‘Nation at Risk’ issued in 1983 was a national call to action. In 1983, the report declared that “the educational foundations of our society are being eroded by a rising tide of mediocrity that threatens our very future as a Nation and a people.”
In the wake of the report, states scrambled to respond. They changed curriculum, adopted standards, lowered class size, increased salaries and funding, provided modest choices for parents not satisfied with their local public school…(over time they’d provide more); states did just about everything they thought would solve the problems.
But how did that go? In 1998, a group of education reform leaders led by CER and former Education Secretary William J. Bennett, assembled to review 15 years of progress of the pathbreaking report that once declared US education to be “a rising tide of mediocrity.” The report we issued, A Nation Still at Risk (1998) found the state of education remained woefully inadequate but with promise for the future if we could be bold enough to change the way we deliver schooling and the expectations we hold of all involved.
Last year, on the 35th anniversary of the release of ‘A Nation at Risk’ the latest NAEP scores were yet again a sobering reminder that far too many children and young adults are not well educated, prepared to enter college or the workforce, and ultimately, able to achieve the level of prosperity this nation offers and makes possible for every citizen.
And now, as we look at the latest results, we again recall the Nation at Risk report’s caution, that “If an unfriendly foreign power had attempted to impose on America the mediocre educational performance that exists today, we might well have viewed it as an act of war. As it stands, we have allowed this to happen to ourselves.”
CER’s Statement on the 2019 Nation’s Report Card
Presented here are past and present reflections on that path breaking report, along with critical analysis of the past administrations of the National Assessment of Educational Progress (NAEP) and trends of improvement, pockets of persistent stagnation and CER’s assessments and recommendations for the innovation needed to drive real change. Stay tuned for more analysis on the 2019 winners and losers on what is called the “Nation’s Report Card”.
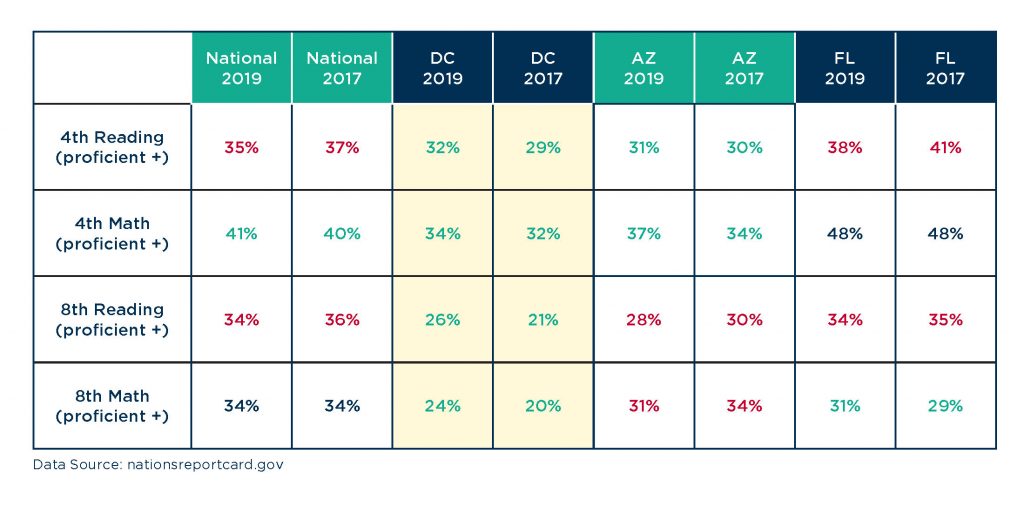
2019 Student Scores In 4th And 8th Grade Reading And Math Were Either Flat Or Declined. There Was Only One Major Bright Spot – Washington, Dc, Which Showed Gains In All Four Combined Categories.
IN ALMOST EVERY CASE, FEWER THAN 40 PERCENT OF OUR STUDENTS LACK PROFICIENCY IN BASIC SUBJECTS, THE GATEWAYS TO SUCCESS IN COLLEGE AND CAREER!
Only 35 percent of 4th grade and 34 percent of 8th grade students performed at or above the Proficient level in NAEP reading, and 41 percent of 4th grade and 34 percent of 8th grade students performed at or above the Proficient level in NAEP math. These results reflect a decline of two percentage points in 4th grade reading and 8th grade reading, no gain in 8th grade math, and a one percentage point gain in 4th grade math – which is not statistically significant – compared to the most recent previous NAEP assessment in 2017.
Scores for African-American, Hispanic and at-risk youth are even more troubling.The following graph shows the national average and the overall scores in DC as well as two other state leaders whose robust choice environment suggests higher than average levels of growth statewide, as well as among minority students, being attributed often to charter schools.
Prior Year NAEP Analysis: From The 2017 Assessment In Reading And Math, Released On April 10, 2018.
In 2015 thirty-six percent of fourth-grade and 34 percent of eighth-grade students performed at or above the Proficient level in NAEP reading (2015 NAEP reading assessment).
In 2017, it’s a dismal picture. The results are not significantly higher than 2015, according to NCES officials. Average 4th and 8th grade math scores are about the same.
Only 8th grade reading scores saw a statistically significant 1 point increase across the nation.
While officials point to a 20-point gain since the 90s, a majority of students still aren’t proficient in core subject and the US achievement gap between students of color, at risk and advantaged students remains a gaping hole.
Our nation is nowhere near where we must be to meet the demands of a highly technological world and ensure that our students most in need of getting ahead have a chance to participate in the future. (For more, see About the 2017 NAEP Results.)
The Sunshine State Is The Big Winner On NAEP
Florida’s experience validates the recommendations of A Nation at Risk
While most states had no significant results, the state of Florida, and 2 of its biggest districts—Miami and Duval—had unprecedented gains. Across the board, significant gains were made by low income students and students with disabilities.
That’s because starting in 1999 and consistently since, Florida adopted measures which held schools, students and communities accountable for results. Schools improved, threatened by the prospects of losing funds, and students. Over time, the Sunshine state adopted an expansive array of opportunities for students, including public charter schools, private scholarships and tax credits, innovations in online learning, early college programs and more. Teachers similarly benefited from the policy changes guiding teacher quality, according to the National Council of Teacher Quality.
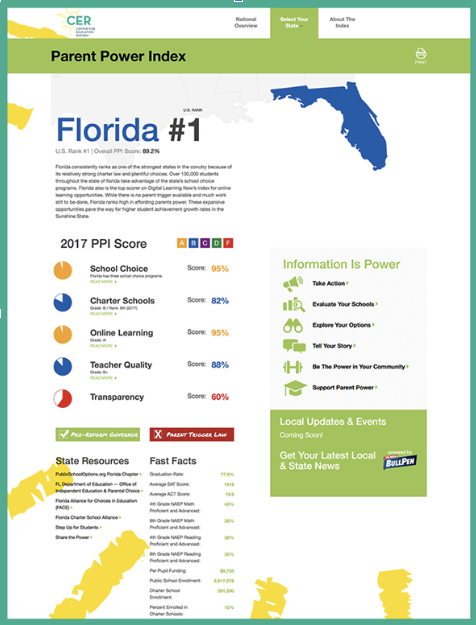
Last year, Florida led all states on CER’s Parent Power! Index, which measures how much power states give to parents to make significant decisions in the educational futures of their kids.
Florida is not the only state which has improved education for kids having adopted bold innovations. Places like Massachusetts, Indiana, Washington, D.C., and Arizona have made impressive gains in recent years. More analysis here.
This year, several cities opted in to participate in NAEP. There were some notable increases among the 27 urban districts which allowed large samples of their students to be assessed.
Average scores increased in six cities and went down in 5. San Diego went up in both subjects in grade 4, Fresno and Miami went up in math, Boston went up in 8th grade reading, and Philly decreased in 8th grade math. Detroit had a significant drop in both subjects, though officials point out that a difference in the size and scope of the population is different than the last assessment.
No matter how you look at it, though, it’s clear that reforms that ensure more opportunity, more freedom and more innovation have likely contributed to the uptick in some states and communities over time. But it’s not enough.
These Are Not Idle Facts…NAEP Scores Track With Lagging Standards In High School.
New data shows that graduation does not equal success (For more, see Correlation Between NAEP & College Readiness.)
What Should We Learn from the 2017 NAEP Results?
For more, see Important Implications of the NAEP Results.
We Must Do More: In 2016, CER cautioned the nation that we were at risk of continued stagnation if we did not act boldly. In
A Manifesto—A Movement at Risk, we reminded all that:
“We are faced with a wave of domestic and international turmoil. Education has never been more important to solving both. And yet, the movement to ensure educational attainment for all is at a crossroads. We are losing ground in part because we are losing the argument. And our hopes of systemic change—our progress—will be lost. We will be a nation at even greater risk, if we do not refocus our collective energies and message to connect with the broader universe of education consumers and citizens everywhere.”
The 2017 Results of the National Assessment of Educational Progress are yet another wake-up call. Will we be bold enough to act this time?